Intro
This is an abbreviated version of a talk I gave at the Africa Internet Summit 2017.
In this blog post I want to show you how you can use RIPE Atlas to get a grip on interesting phenomena in the African Internet, even though RIPE Atlas doesn’t have that many probes in most African countries. I will show the use of a new RIPE Atlas tool called traceMON.
Population Coverage
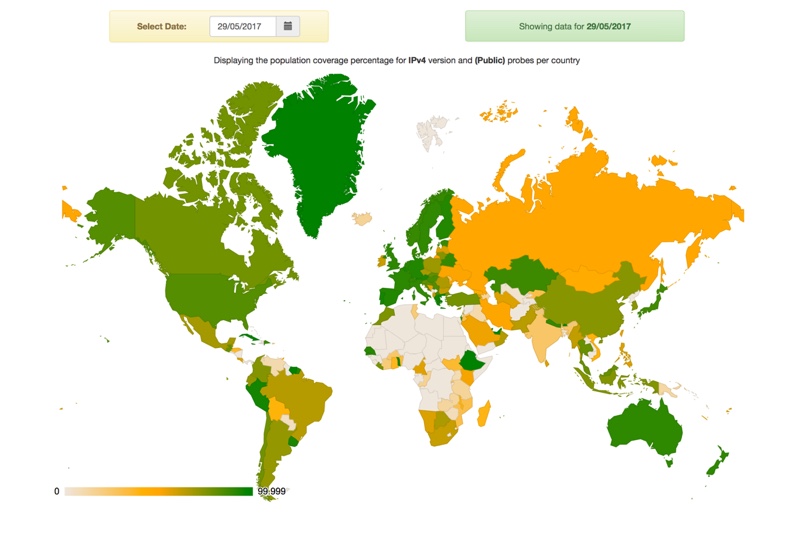
Since the beginning of RIPE Atlas we have been recording statistics about the number of probes in each country in the world. Unsurprisingly, most of the probes are located in either European countries or in the Unites States of America. It is not until very recently, though, that we’re trying to track the number of people that one probe connection would represent. Petros Gkigkis a Masters Student at the University of Crete/FORTH, produced a map that features the estimated percentage of the population that is covered by RIPE Atlas probes for any country. (http://sg-pub.ripe.net/petros/population_coverage/table.html)
fig. 1
He combines data from APNIC that provides the population percentage above a certain threshold with the presence of RIPE Atlas probes in these ASes. The resulting data is shown on a per country basis in the map above [fig.1]. Green areas would represent countries with the highest coverage, whereas the grey areas represent countries with the lowest coverage.
Coverage in Africa
As you seen see a lot of African countries are grey. First of all I want to say that we have good hopes that this will change in the near future. AFRINIC and Internet Society will be deploying a significant number of anchors within IXPs all over Africa. It is the experience of the RIPE Atlas team that deploying anchors within a region will also cause a surge of deployed probes in the vicinity.
But you don’t need a lot of probes to do interesting things with RIPE Atlas as I want to show you with the case of the deployment of Liberia-IX.
Use Case: Liberia-IX Uptake
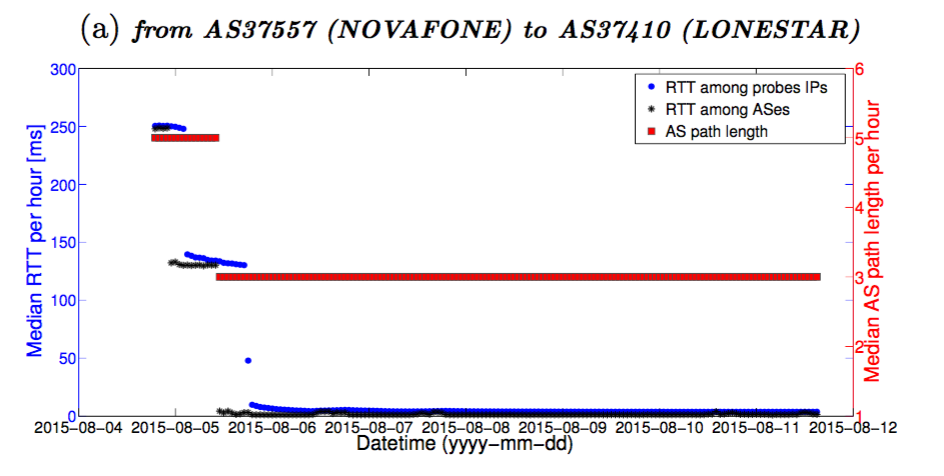
In August 2015 the Liberia-IX was launched. In a paper by R. Fanou et. al. called "Four Years Tracking Unrevealed Topological Changes in the African Interdomain" the deployment was tracked by creating RIPE Atlas measurements on the probes that should be affected by changes in their routing around the time period the deployment took place. In the diagram [fig.2] you can see the change in the length of the AS path before, during and after the activation of the IXP as published in the aforementioned paper.
fig. 2
Since RIPE Atlas stores all measurement results indefinitely and publicly available we can retrace these results and see what happened with tooling that wasn’t available at the time the measurements were created. One such tool is TraceMON. It allows you to visualise traceroutes from RIPE Atlas measurements as a graph. It combines different traceroutes in one comprehensive graph. Finally, it can animate the changes in traceroute results over time.
fig 3.
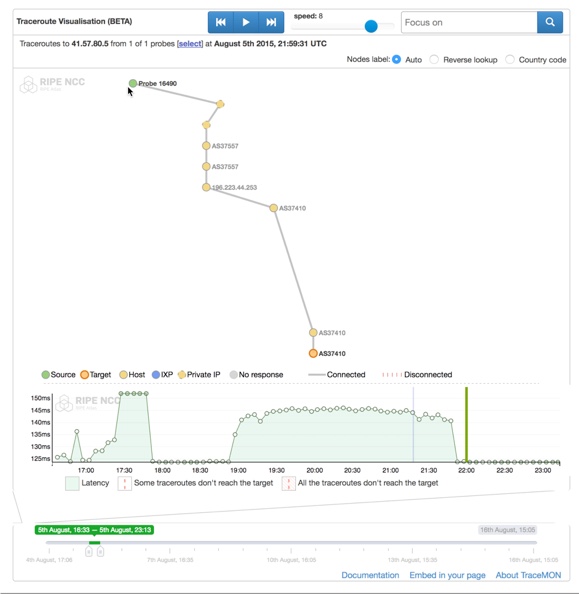
Fig. 3 shows a traceroute from a probe in Liberia belonging to the AS of Novafone and destined for an IP address within the AS of LoneStar. Both ASes are based in Liberia and are at present participating in the Liberia-IX. This particular traceroute however was performed **before** the deployment of the IXP. If you would go to TraceMON for this measurement - and I encourage you to - you would see that this is a pretty typical path for this traceroute before the activation of the IXP. I have prepared a link to the actual TraceMON visualisation here.
Below the graph lives a timeline with a diagram that shows the RTT for every source-destination pair over time. The time window starts at August, 15 15:45 UTC and continues to somewhat over 22:00 UTC of the same day. On the left of the diagram is a period with a lot of volatility, then a period with consistent low rtts and then a period with higher latency, but far more stable than the first period. The current traceroute that is shown in the graph was taken at 11:57, as can be seen above the graph. The first period corresponds with the pre-deployment situation, whereas the other two periods are both situations during the deployment.
You can see in the graph that the traceroute passes through three ASes before going through 6 hops in a AS that belongs to Cogent, passing through one other AS, before finally turning up in the destination AS. Now both the source and destination address of this traceroute are located in Liberia. All of the hops seen as belonging to the Cogent ASes are located in the USA. So both the latency diagram as well as the traceroute graph indicate that this is a highly inefficient path.
Now let’s take a look at fig.4. This is a traceroute from the same RIPE Atlas measurement, but now the graph shows a traceroute from 21:59 the same day. Here the AS path has dramatically changed and the RTTs have consistently gone down to tens of ms instead of week into the hundred. Also, the graph indicates that the AS path has reduced from traversing six ASes to three. These three consist of the source AS, the IXP peering LAN (the unidentified IP address) and the destination AS. This is the post-deployment situation.
fig. 4
If you head over to <https://massimo.ripe.net/tracemon/widget/liberiaix.html> you can see the animation of the complete deployment of Liberia-IX with all the back and forth switching between the old AS paths and the new ones, including a few quirks that get ironed out in the meantime.
TraceMON lets you view visualisations for all traceroute measurements performed by RIPE Atlas and - if you’re a probe host - you can schedule your own traceroutes and visualise them with TraceMON. Note that we have lots of other tools to help you monitor ASes, networks and domains and many more. Head over to RIPE Atlas to see what’s possible.
So if you don’t host a probe yet, apply for one here and get your measurements started.
About the Author
Jasper den Hertog is working for the RIPE NCC in the R&D department as a developer on the team that produces RIPE Atlas. Before joining the RIPE NCC he worked as a freelance 3D and web developer as well as a sysadmin for over 15 years. He holds a degree in engineering from the Delft Technical University.


